STEP TWO: ADDING THE GRAPH
To make sure everything works right, we'll enter dummy data: Type
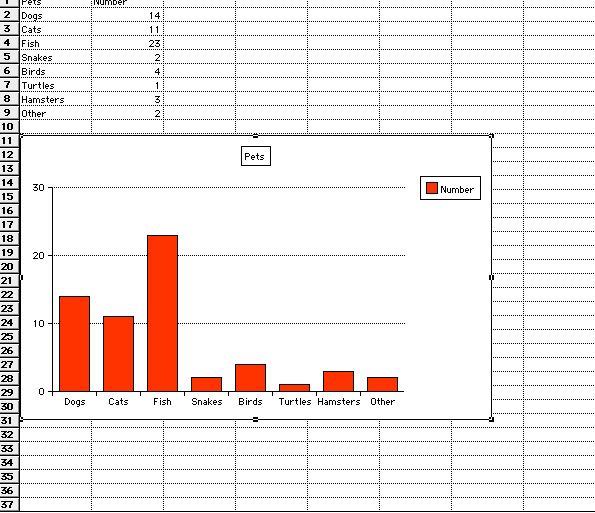
the data below in the cells indicated:
- Cell B2: 14
- Cell B3: 11
- Cell B4: 23
- Cell B5: 2
- Cell B6: 4
- Cell B7: 1
- Cell B8: 3
- Cell B9: 2
Click and drag the mouse to highlight cells A1 through B9. Then,
click the Make Chart button at the top of the screen. Choose Bar
and Click OK. You now should see a bar chart superimposed on your
spreadsheet. Drag the chart so the top left corner is in cell A11.
You also might want to enlarge the chart so the types of pets
don't run together. Click the bottom right corner and drag it down
and to the right until the corner reaches cell G31. Click Window>Page
View to double-check that everything fits on one page. Your page
now should look like this:
Save your work.
Next: Add finishing touches.
|

