STEP THREE: FINISHING TOUCHES
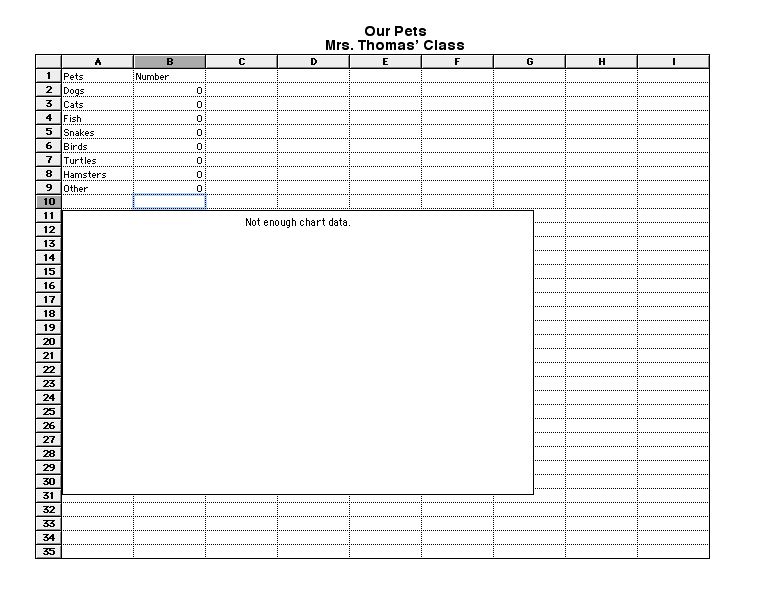
Erase the data in cells
B2 through B9, replacing them with zeroes. The zero will help students
see where to click to type the real number for each animal. Note
that your chart has disappeared and a message reads, "Not Enough
Chart Data." That's fine.
Click Format>Insert
Header. Type "Our Pets," hit Return, and type the name of your class.
(Mrs. Thomas' Class, for example). Your screen now should look like
this:
If you like, you now can change
the font size or other formatting. Then, save your work.
Now you're going to
save the graph a second time -- as a template. A template is a file
students can open and work on without changing the saved version.
That allows you to use the same file for many students or many classes.
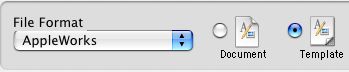
Click File>Save As.
Click the down arrow
next to the Save As field. In the larger Save window that appears,
click the Template button.
In the Save As field,
make sure the file is named something like PetGraph. Note that the
extension -- the letters after the period -- are now "cws," not
"cwk." The extension cws indicates that the file is a template.
Save the file on any student computers. You now are ready to
use it in class.
Walk students through the steps of clicking next to each pet
name and typing the number of pets they, their group, or the class
as a whole have. Discuss how the chart changes as more or less
pets are added. Ask which bars are taller and why. Before printing
the graph, have each student click in cell A33 or somewhere close
to there and type his/her name. That's it!
Next: Add finishing touches.
|

