
|
|
 |
|
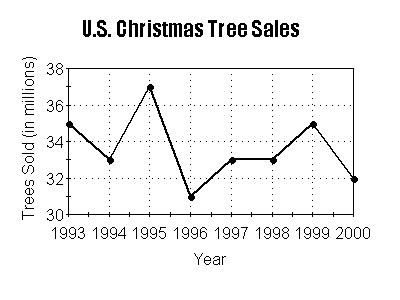
| DIRECTIONS: The graph shows how many millions of Christmas trees were sold in the U.S. between 1993 and 2000. Study the graph. Use the graph to answer the questions below. | |
| 1. | How many million Christmas trees were sold in the year 2000? _________________ |
| 2. | Were more Christmas trees sold in 1993 or 1994? ____________________ |
| 3. | About 33 million Christmas trees were sold in 1994 and 1997. In which other year were 33 million trees sold? ___________________ |
| 4. | Christmas tree sales increased between 1994 and 1995. How many more million trees were sold in 1995 than in 1994? ____________________ |
| 5. | In 1996, 31 million Christmas trees were sold. Did sales the following year go up or down? ____________________ |
| 6. | How many trees were sold in all during 1999 and 2000? ____________________ |
| © 2002 by Education World®. Education World grants educators permission to reproduce this page for classroom use. | |